Trends in Fees, Salaries & Performance
Agency Recruiting Benchmark Report: Manufacturing
As the employment market is moving at breakneck speed, our valuable reports have evolved in-kind to be an ongoing reflection of key happenings impacting critical industries. Consider this your go-to source for the latest in salary, fee, and industry benchmark data when hiring for critical talent and creating your most competitive offers yet. We’ll regularly update these core analytics ensuring you always have the latest data at your fingertips. This report focused on Manufacturing, dives into data analytics influencing recruiting in this growing industry as well as across the hiring market in general. In addition, we also take a look at some of the biggest trends in salaries and fees impacting this industry now.
THE DATASET: AT-A-GLANCE
BOUNTYJOBS MANUFACTURING JOB ACTIVITY
JOB POSTINGS: PUBLIC V. PRIVATE
How do our employers determine the visibility of their Manufacturing jobs?
BountyJobs accommodates employers that want to manage their existing preferred vendors, as well as those who wish to connect to new agencies.
Manufacturing companies use their preferred vendors almost half the time, while posting their roles to the marketplace about 60% of the time.
PUBLIC:
Public jobs are posted and visible to our marketplace of 10K+ agencies
PRIVATE:
Private jobs are posted privately, visible to vendors by invitation only
BY THE CALENDAR
What time of year do Manufacturing employers go to external search? How does that compare to the market in general?
Manufacturing companies have a pretty steady hiring pattern with a slight decline at the start of the new year and again mid-year.
BY SENIORITY LEVEL
What is the breakdown of Manufacturing jobs sent to search by seniority level?
NON-MANAGERIAL
74%
MANAGER
25%
DIRECTOR
1%
VP or C-SUITE
.3%
The majority of Manufacturing jobs sent to search are non-managerial positions. Employers in this industry tend to look for highly specialized candidates for roles such as Information Security Architect, Corporate Manufacturing Director, and Senior Data Scientist.
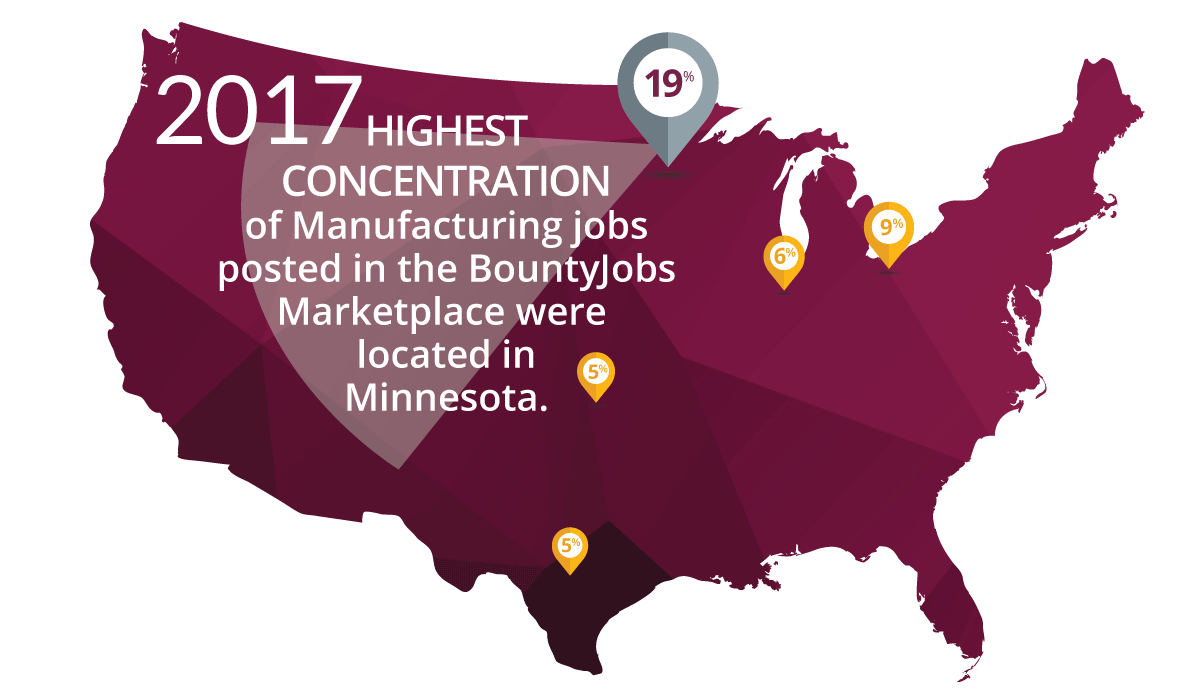
BY GEOGRAPHIC DISTRIBUTION
Where are Financial Services jobs geographically located?
While there were some regions of high concentration for Pharma & Biotech job postings in 2017, most jobs were spread across the country, with postings in 41 states and Canada.
JOB POSTINGS BY JOB CATEGORY
What is the breakdown of Manufacturing jobs by job category?
ENGINEERING
OTHER MANUFACTURING
QUALITY
PLANT MANAGEMENT
MANUFACTURING PRODUCTION
SALARIES & FEES: YEAR-OVER-YEAR TRENDS
Competition for skilled talent is incredibly high in Manufacturing. A recent study found that the skills gap in Manufacturing may leave an estimated 2.4 million positions unfilled between 2018 and 2028. This could mean 2.5 trillion open roles impacted.
This industry is being impacted by innovation and technological advances more than most. Filling roles requiring digital talent and skilled production, as well as jobs such as operational managers, may be three times as hard to fill in the next three years.
YEAR-OVER-YEAR SALARY AVERAGES (Adjusted for inflation)
Manufacturing salaries have remained lower than market averages, but the gap is starting to narrow just slightly as Manufacturing salaries are on the rise. We also see that agency fees have hovered around 21 percent in recent years. The skills gap plaguing this industry could be a contributing factor in salary increases, to lure those top candidates in this tight market.
YEAR-OVER-YEAR FEE AVERAGES
SALARIES: LAST 12 MONTHS
SALARIES BY BAND
What was the distribution of salaries for Manufacturing jobs?
>$50K
$50K – $100K
$100K – $150K
$150K – $200K
$200K+
SALARIES BY SENIORITY LEVEL
What were salary averages for Manufacturing jobs by seniority level?
FEES: LAST 12 MONTHS
JOB POSTINGS BY FEE CLASSIFICATION
What was the distribution of jobs posted relative to fees? How does that compare to the market in general?
Manufacturing
DISCOUNT
Below 20%
MARKET
Between 20% – 25%
PREMIUM
Between 20-25%
MARKET
Placement fees for Manufacturing roles generally fall within 20 to 25 percent of the candidate’s first year salary, which this year matches general market usage. Fees also rarely fall below 20 percent but in 2017 saw a large percentage of 30% for those that exceed 25 percent fees for these roles.
FEES BY SENIORITY LEVEL
What were fee averages for Manufacturing Jobs by seniority level?
NON-MANAGERIAL
21%
MANAGER
22%
DIRECTOR
22%
VP or C-SUITE
20%
PERFORMANCE
Once you’ve determined salaries and fees, when can you reasonably expect to see resumes, interview candidates, and hire your new employee? Comparing your company’s data against industry benchmarks can be useful to help you measure your agency performance and identify areas for improvement. If, for instance, your first interviews take longer than the industry average, consider running an intake session to become better aligned with your agencies.
Keep in mind, however, that benchmarks are averages for jobs with wide ranging characteristics. There are a variety of factors that affect search activities and performance metrics. Some factors may be out of your control, such as a scarcity of talent in your area. Beyond that, every company’s hiring process is unique, and your performance metrics should reflect that.
BOUNTYJOBS RECRUITMENT TIMELINE
AGENCY PERFORMANCE STATISTICS FOR MANUFACTURING ROLES
How does agency performance and engagement compare from the market to Manufacturing?
Average # of candidates submitted per Manufacturing position:
14 Candidates
MARKET AVERAGE: 11.75
Manufacturing roles typically command a higher number of agencies working on open roles. As well, the number of agencies directly invited to work on private roles far outnumbers the Market Average. This is due in part to the confidential nature of these roles.
Average number of agencies invited on a private Manufacturing position:
10 AGENCIES
MARKET AVERAGE: 2.5
Average number of agencies engaged on a public Manufacturing position:
8 AGENCIES
MARKET AVERAGE: 8.7
TIME TO FILL
A variety of factors affect time to fill (TTF), including title, salary, seniority level, and scarcity of talent in a particular role. For example, time to fill increases by 15% for roles with C-suite, VP or Director in the job title, and 41% for roles with salaries of $150,000 or higher.
We’ve selected a sample of actual Manufacturing jobs filled on BountyJobs in 2017.
BEST PRACTICES: BOUNTYJOBS MANUFACTURING RECOMMENDATIONS
Manufacturing is a highly competitive industry and specialized labor is in high demand. Below are 4 best practices to increase the effectiveness of hiring in Manufacturing as well as employer/agency collaboration.
BOUNTYJOBS RETAINED SEARCH
All Your Direct-Hire Placements Under One Roof
BountyJobs takes the pain out of managing retained search engagements by allowing you to track and manage all your direct hire placements in one location. We’ve added retained-only features to keep those critical job searches moving smoothly – including automatic, milestone triggered progress.
ASK BOUNTYJOBS
Want fee & compensation information for specific roles? Roles in IT vary widely, and your strategies for recruiting top IT talent should too. The best place to start is by looking at fee and compensation information for the specific roles you are interested in. Contact BountyJobs at info@bountyjobs.com so we can help.