Trends in Fees, Salaries & Performance
Agency Recruiting Benchmark Report: Information Technology
As the employment market is moving at breakneck speed, our valuable reports have evolved in-kind to be an ongoing reflection of key happenings impacting critical industries. Consider this your go-to source for the latest in salary, fee, and industry benchmark data when hiring for critical talent and creating your most competitive offers yet. We’ll regularly update these core analytics ensuring you always have the latest data at your fingertips. This report focused on Information Technology, is particularly interesting because it’s both a job category and a high volume industry in the BountyJobs Marketplace. In addition to sharing vertical-specific data, we’ve also interjected some general market data for comparison. That way, you can see how your agency recruitment metrics stack up against others in IT as well as the market as a whole.
THE DATASET: AT-A-GLANCE
BOUNTYJOBS IT JOB ACTIVITY
NON-MANAGERIAL
Percentage of overall IT positions posted for non-managerial roles
NON-MANAGERIAL
Percentage of overall IT positions posted for managerial roles
JOB POSTINGS: PUBLIC v. PRIVATE
How do our employers determine the visibility of their IT jobs??
Jobs posted publicly to our marketplace saw a decline in 2017 as more employers posted jobs privately to specific vendors.
With IT jobs present in almost all verticals, there are many agencies that specialize in IT talent. While some companies like to introduce a little friendly competition by bringing in new search vendors, others prefer to stick with their tried-and-true vendors.
PUBLIC:
Public jobs are posted and visible to our marketplace of 10K+ agencies
PRIVATE:
Private jobs are posted privately, visible to vendors by invitation only
BY THE CALENDAR
What time of year do IT jobs get sent to external search? How does that compare to the market in general?
IT jobs are spread across all industries, so they follow a vacancy pattern similar to that of the general market. They remain fairly consistent throughout the year with the common end-of-year dip. In 2017 we saw a lift in Q1, showing employers were back at it right after the holidays to secure that critical talent.
BY SENIORITY LEVEL
What is the breakdown of IT jobs sent to search by seniority level?
NON-MANAGERIAL
75%
MANAGER
22%
DIRECTOR
3%
VP or C-SUITE
<1%
The overwhelming majority of Information Technology jobs sent to search are non-managerial positions. However, the percentage of managerial positions increased from 13% in 2016 to 22% in 2017. Employers in this industry tend to look for highly specialized candidates for roles in Software Development, Software Engineering, and IT Security.
BY GEOGRAPHIC DISTRIBUTION
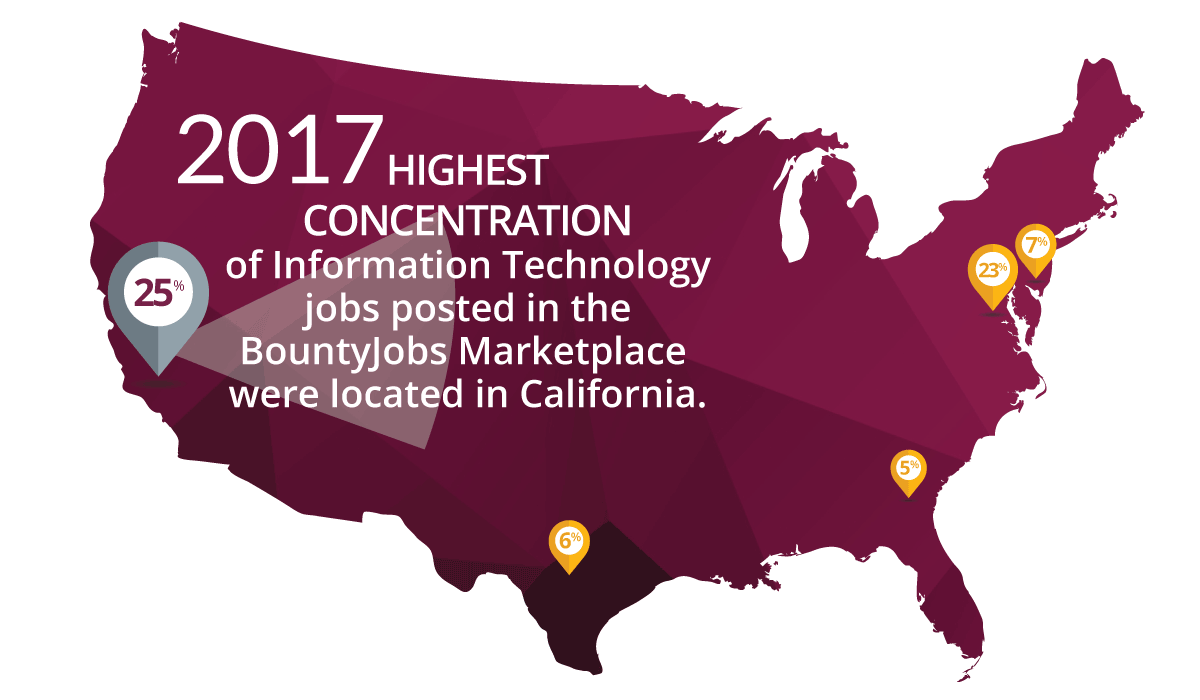
Where are Information Technology jobs geographically located?
While highest concentration of Information Technology job postings in 2017 were found on the West coast of the United States, jobs were also spread across the country and abroad, with postings in 31 states, Canada and the European Union.
BY INDUSTRY
What industries had the highest volume of IT jobs sent to search in 2017?
Information Technology
Top Sub-Industries Include: Computer Software & Internet/ E-Commerce
Sales & Marketing
Top Sub-Industries Include: Sales Management & Business Development
Engineering
Top Sub-Industries Include: Systems & Engineering Design
BY JOB CATEGORY
What job categories had the highest volume of IT jobs sent to search in 2017?
The largest search volume in 2017 within IT job categories was for Developers. Companies across industry verticals sent jobs for Developers out to search.
PROGRAMMING
BUSINESS INTELLIGENCE
SALES & SALES MANAGEMENT
ENTERPRISE SOFTWARE IMPLEMENTATION
DEVELOPER
SALARIES & FEES: YEAR-OVER-YEAR TRENDS
From Financial Services to Healthcare, companies across all verticals are sourcing candidates from the same talent pool for their critical IT roles. While some industries are accustomed to paying top dollar for specialized talent (e.g. Pharmaceutical and Biotechnology companies pay average salaries that are 22% higher than the general market), employers filling IT roles can pay mid-market rates and still fill their roles.
However, IT roles cover a broad set of job categories, with a broad range of skill sets and corresponding salaries. For this reason, salaries and fees are a crucial leverage point for use in securing top IT talent.
Employers need to stay up to date on salary and fee data for the specific IT roles they seek to fill so they can be competitive in the talent market. An organization that pays below industry averages for salary and fees is likely losing qualified candidates. Conversely, an organization that pays above industry averages may be spending more than they have to get the right candidate.
YEAR-OVER-YEAR SALARY AVERAGES (Adjusted for inflation)
As noted previously, IT jobs are spread across industries, and because of this the corresponding salaries and fees tend to follow market trends fairly closely. However, the average IT salary was $128,907 in 2017—just over 14 percent higher than the average market salary.
After a significant jump in average salaries in 2015, IT salaries came back down in 2016 . Despite this recent drop, average salaries are still trending upward. Agency fees have also trended slightly upward since 2010 — leveling off in the last 3 years around 20%.
YEAR-OVER-YEAR FEE AVERAGES
SALARIES: LAST 12 MONTHS
SALARIES BY BAND
What was the distribution of salaries for IT Jobs?
>$50K
$50K – $100K
$100K – $150K
$150K – $200K
$200K+
SALARIES BY SENIORITY LEVEL
What were salary averages for IT Jobs by seniority level?
FEES: LAST 12 MONTHS
JOB POSTINGS BY FEE CLASSIFICATION
What was the distribution of jobs posted relative to fees? How does that compare to the market in general?
The approach to fees for IT roles varies significantly fromthe market at large. While over half of the jobs in the overall market pay fees between 20 and 25 percent of the candidate’s first year salary, 92% of IT roles fall into this fee category. Additionally, the use of premium fees is a relatively rare practice for employers filling these roles, as fees rarely exceed 25 percent…though 2017 did see an increase to 6%, up from 2% in 2016.
Information Technology
DISCOUNT
Below 20%
MARKET
Between 20% – 25%
PREMIUM
Between 20-25%
MARKET
FEES BY SENIORITY LEVEL
What were fee averages for IT Jobs by seniority level?
NON-MANAGERIAL
20%
MANAGER
21%
DIRECTOR
21%
VP or C-SUITE
20%
PERFORMANCE
Once you’ve determined salaries and fees, when can you reasonably expect to see resumes, interview candidates, and hire your new employee?
Comparing your company’s internal recruiting data to benchmarks can be useful to help you measure your agency performance and identify areas for improvement. If, for instance, your first interviews take longer than the market average, consider running an intake session to become better aligned with your agencies.
Keep in mind that there are a variety of factors that affect search activities and performance metrics. Some factors may be out of your control, such as a scarcity of talent in your area. Beyond that, every company’s hiring process is unique, and your performance metrics should reflect that.
BOUNTYJOBS RECRUITMENT TIMELINE
AGENCY PERFORMANCE STATISTICS FOR IT ROLES
How does agency performance and engagement compare from the market to IT?
Average # of candidates submitted per Information Technology position:
12 Candidates
MARKET AVERAGE: 11.75
IT roles tend to have a slightly higher number of agencies working on open roles as well as a slightly higher number of candidates. The commonneed for IT roles across verticals yields a higher number of agencies specialized in IT roles.
Average number of agencies invited on a private Information Technology position:
3 AGENCIES
MARKET AVERAGE: 2.5
Average number of agencies engaged on a public Information Technology position:
10 AGENCIES
MARKET AVERAGE: 8.7
TIME TO FILL
A variety of factors affect time to fill, including title, salary, seniority level, and scarcity of talent in a particular role. In addition, IT roles require varying skillsets and technical experience that also factor into time to fill.
Roles in other industries or job categories become more challenging to fill with increased seniority, but that’s not the case with IT roles. Instead, the more technical and specialized non-managerial roles are the most difficult to fill.
We’ve selected a sampling of common IT roles filled on BountyJobs in 2017, and provided the salary and time to fill for each.
BEST PRACTICES: BOUNTYJOBS IT RECOMMENDATIONS
Companies from every industry are competing for skilled candidates to fill their critical IT roles. Based on our marketplace activity for 2017, below are four best practices to increase the effectiveness of your agency collaborations for IT roles.
BOUNTYJOBS RETAINED SEARCH
All Your Direct-Hire Placements Under One Roof?
BountyJobs takes the pain out of managing retained search engagements by allowing you to track and manage all your direct hire placements in one location. We’ve added retained-only features to keep those critical job searches moving smoothly – including automatic, milestone triggered progress.
ASK BOUNTYJOBS
Want fee & compensation information for specific roles? Roles in IT vary widely, and your strategies for recruiting top IT talent should too. The best place to start is by looking at fee and compensation information for the specific roles you are interested in. Contact BountyJobs at info@bountyjobs.com so we can help.